Welcome back to investing for students. Last time, we talked about the principles of investing for students. We talked about the problems with transaction fees, and the level of risk aversion that you must determine for yourself before you start investing. In this second part, we are going to talk about how to analyze equities in your investment opportunities and how you can take advantage of this.
If you want to invest in whatever financial product, you have to follow the news. This is the most important thing you have to do when you are investing. This can be explained as follows. Valuation theories state that when having perfect capital markets, all information is immediately priced in in the stock price (we are talking about equities here). Perfect capital markets are markets where assets are priced in total efficiency. So, in a perfect capital market, there are no arbitrage opportunities. Well, perfect capital markets do not exist, but lately, we have been coming very close. For example, the takeover bid of NN Group on Delta Lloyd. The bid was priced at 5.40 EUR per share, but it is just a bid, so there is some uncertainty. The takeover could not succeed, for example, so this risk is also priced in. When the bid is made public, the stock price of Delta Lloyd increases immediately to around the bid price. Sometimes it is slightly lower because the market believes that there is still some uncertainty or risk, but other times it could be slightly higher because the market believes that there would be another, higher, bid.
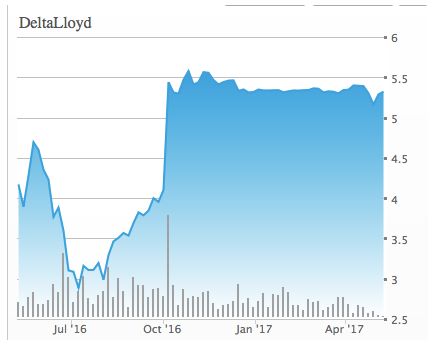
As you can see in the stock chart, the stock price increased immediately after the news of the takeover bid went public in October. This makes sense, because when the takeover bid is accepted and nothing can go wrong anymore, you have an arbitrage opportunity if the stock price is not at the current level of the takeover bid. If the takeover bid is 5.40 EUR and the stock price is 5.00 EUR, as in the case described above, you could make a risk-free profit of 0.40 EUR per share. This is because you are ensured that NN Group is going to buy your stock for 5.40 EUR. This is how a perfect capital markets works.
So, you now know how a perfect capital market works and that information is almost immediately priced in. You can understand why it is important to follow the news, but what should you look for? First of all, begin with your own agenda. Note all general shareholders’ meetings of stocks you are following or own. Read the minutes as soon as possible for any profit warnings or other information that could influence the stock price. The same applies to the publishing dates of monthly, quarterly, or yearly reports. First, read the predictions of various famous analysts from the major banks. If the market believes that the company is going to have a loss of 210 million, this will already be priced in before the yearly report is published. When the loss, eventually, seems to be 200 million, the stock price will increase due to a smaller loss than was expected, and therefore priced in. This also applies to macro developments. For example, Shell depends mostly on the price of oil. When production remains constant, costs will do so too. However, profit will not remain constant due to a variable oil price, and thus a variable selling price per barrel of oil. If oil prices increase, the profit of Shell should increase too and vice versa. As you might know, cash flows are a determinant in equity valuation models, so therefore, if oil prices rise, stock prices will increase too due to higher cash flows.
So, now that you have determined a sector to invest in (i.e. the oil sector), how do you pick the right stocks? This is the part where all ratios, like the price per earnings ratio, are coming in. First of all, what are you looking for? When you are looking for more volatile stocks, you should take a high-beta-stock, for example. When you have determined the level of volatility of your portfolio, you have to pick the right stocks. You can analyze profitable stocks by using some ratios. The higher (or lower) the ratio, the better the stock. If the ratio is above (or below) sector average, you know that the stock is above sector average and might be a profitable stock. We are going the discuss the methodology of frequently used ratios. For formulas, please search the internet.
Earnings per share (EPS): EPS is basically the profit that a company has made over the last year divided by how many shares are on the market.
Price per earnings (P/E ratio): The price/earnings ratio (P/E) is the best known of the investment valuation indicators. The P/E ratio has its imperfections, but it is nevertheless the most widely reported and used valuation by investment professionals and the investing public. A high P/E ratio means investors are paying more for today’s earnings in anticipation of future earnings growth.
Debt to equity ratio: The debt-equity ratio is a leverage ratio that compares a company’s total liabilities to its total shareholders’ equity. This is a measurement of how much suppliers, lenders, creditors and obligors have committed to the company versus what the shareholders have committed. A lower number means that a company is using less leverage and has a stronger equity position.
Dividend yield (interesting for dividend stocks): A stock’s dividend yield is expressed as an annual percentage and is calculated as the company’s annual cash dividend per share divided by the current price of the stock. The dividend yield is found in the stock quotes of dividend-paying companies.
Current ratio: The current ratio is a popular financial ratio used to test a company’s liquidity (also referred to as its current or working capital position) by deriving the proportion of current assets available to cover current liabilities. The concept behind this ratio is to ascertain whether a company’s short-term assets (cash, cash equivalents, marketable securities, receivables, and inventory) are readily available to pay off its short-term liabilities (notes payable, current portion of term debt, payables, accrued expenses, and taxes).
When you understand the methodology of these ratios, you can analyze stocks for specific purposes. If you want a healthy, unleveraged stock, you could use the current ratio and debt to equity ratio to analyze which stock fits this criterion, for example. You have to make yourself comfortable with different kinds of ratios to do proper analysis and know where to use which ratio.
This was the last part of the Investing for Students series. Use a market simulator to test if you are ready to go on real financial markets, and I will see you there!
Disclaimer: all named stocks are just for explanatory purposes. The situations described to explain some investment concepts are unrealistic and only serve explanatory purposes. Nothing in this article reflects any investment advice of myself or the company that I am currently employed at. Please note that investing is not without risk and that you could lose money on your investments.
Bewaren
Comments